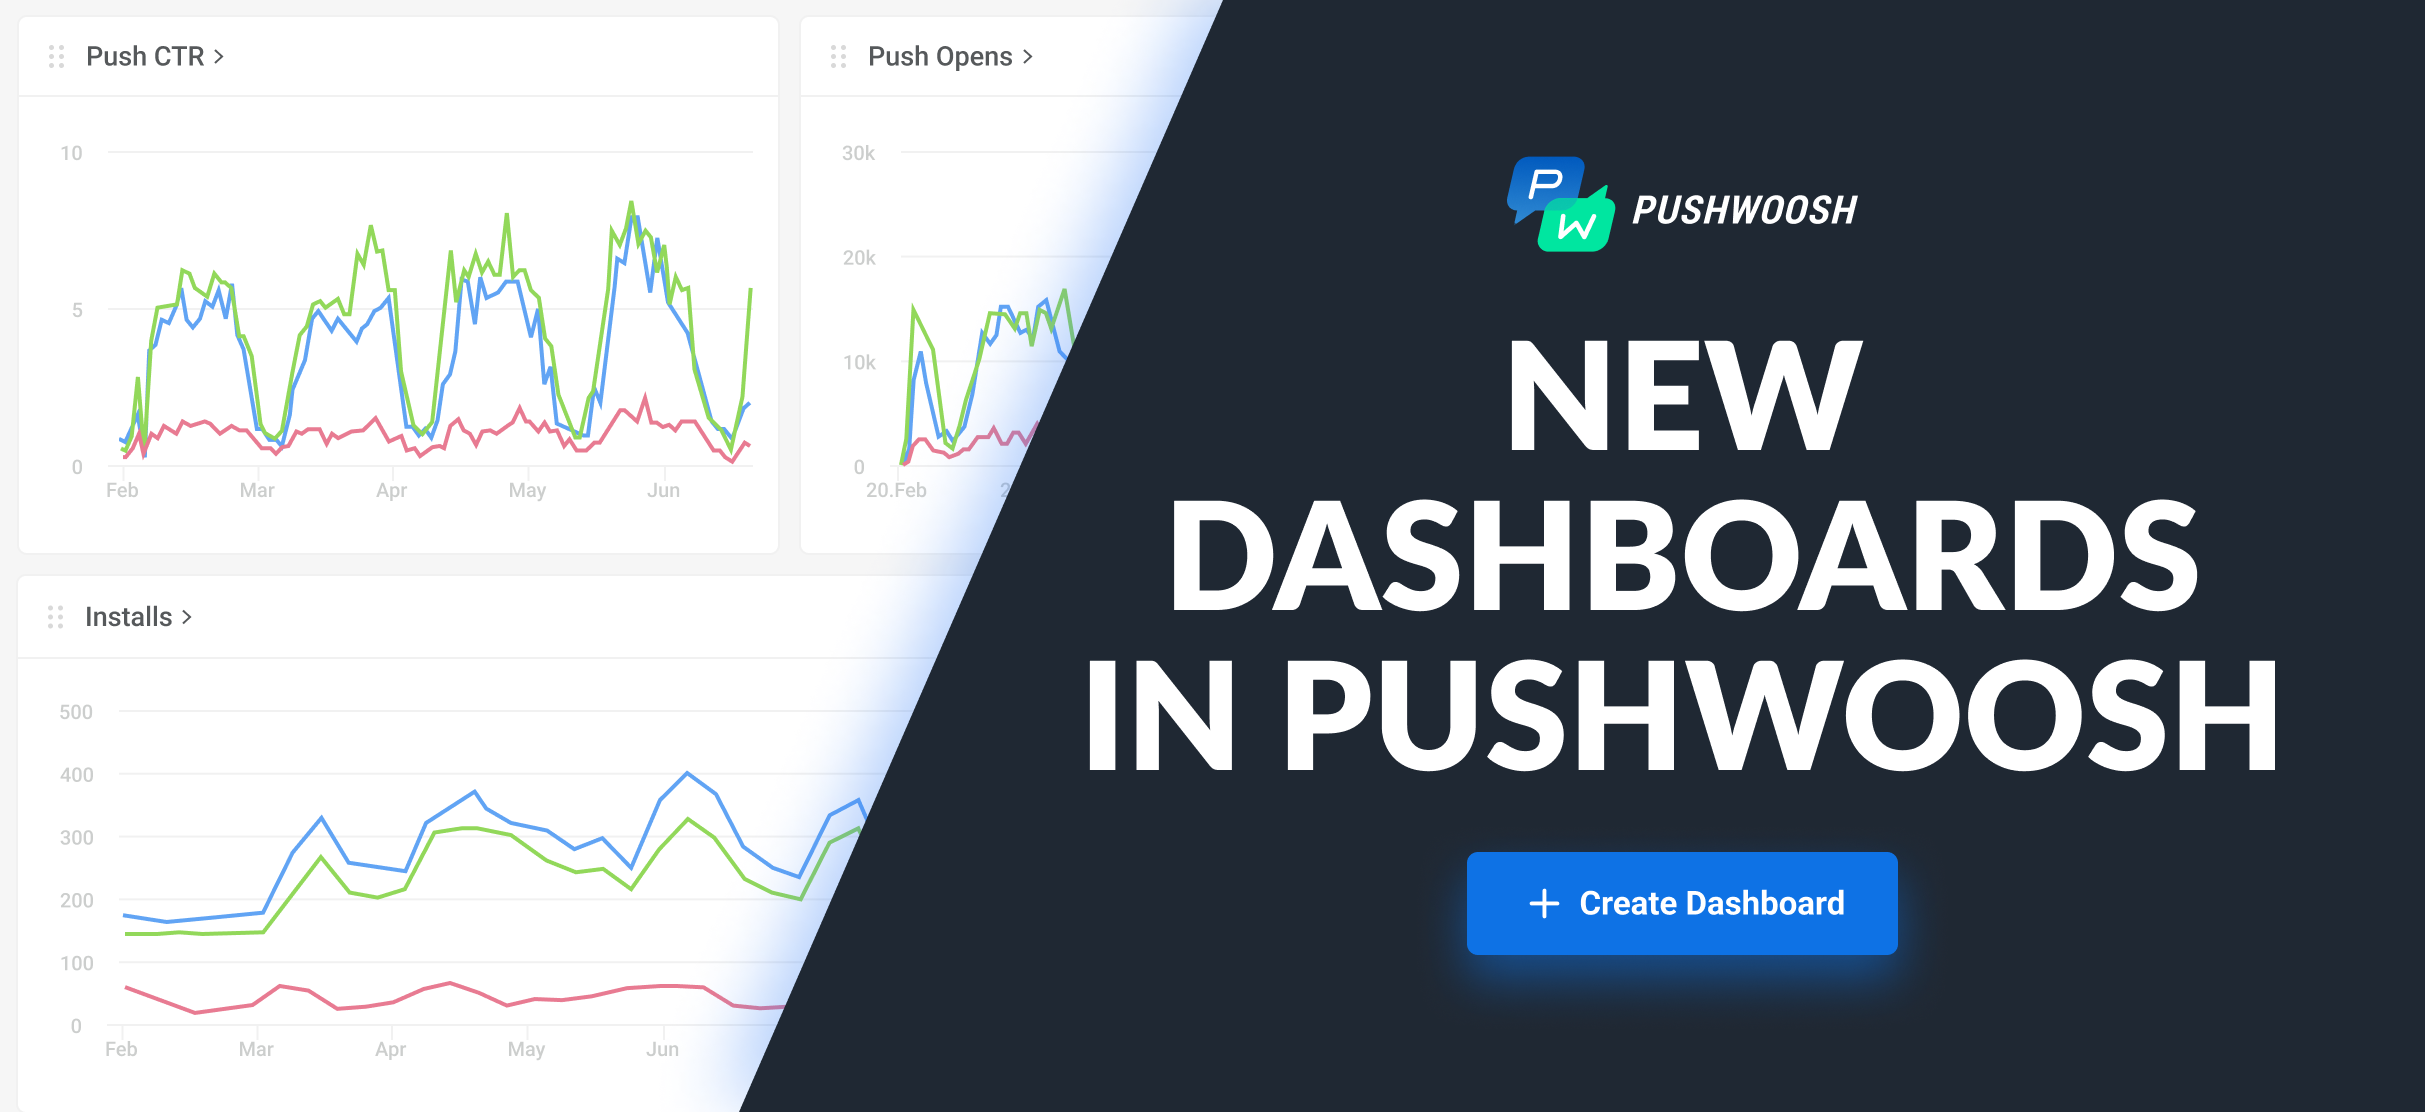
Pushwoosh Dashboards: A new perspective on your app and messaging performance
Visualize your performance on messaging channels and keep you up-to-date on your audience, event, and app metrics with new Pushwoosh Statistics Dashboards.
What’s in Pushwoosh Statistics Dashboards?
🕒 Get a quick overview of the key metrics
📈 Visualize your performance trends across channels, triggered events, and app progress over time
📊 Create custom charts and dashboards
📑 Share reports with your team
You can use our pre-made Dashboards or create a custom one. Try now.
📝Read the complete walkthrough in our documentation
Levels of analytics
Depending on your goals, you may require different levels of analytics.
1️⃣ Messaging analytics
Pick the Push notifications, Emails or In-apps dashboards.
Here, you can evaluate your push campaigns performance:
- Do you achieve to grow the number of recipients? In other words, are more and more users opting in for pushes? Or are you losing them?
- How engaging is your content?
- Stay on top of how many pushes you sent vs how many of them were delivered and opened.
- See your app user base growth and decline.
In-app message senders can track Impressions and Interactions with their popups—there’s a dashboard for that! More about in-app messaging metrics.
And email marketers have their dedicated report as well. All the regular metrics
that show if your email campaign was a hit or a miss are there in the charts.
2️⃣ Application performance
Here, you can track your app performance and audience metrics and assess if you succeed in user acquisition, engagement, and retention.
Customize the dashboards
You can customize any of these template dashboards and, for example, track iOS and Android metrics separately.
If you want to keep an eye on any communication, audience, or events metrics, you can add them to the dashboards.
And if you have a better idea of what your perfect dashboard looks like,
we invite you to create a custom dashboard from scratch.
Choose the period you want to monitor: from just one day to 12 months or within your custom dates.
Report on your progress & Share insights with your team
Last but not least, you can export a PDF with your report and share it with your team.
Achieve every metric you pursue with Pushwoosh
With Pushwoosh Statistics Dashboards, you’re pretty much covered on the analytics. Take the most of other features of the Pushwoosh platform to see positive trends in your metrics reports.
Log in to Pushwoosh to create your Dashboard.
Not a Pushwoosh user yet? Sign up now and get complete access to the platform:


